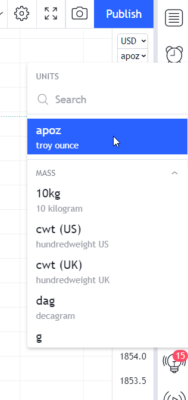
TradingView has added a new feature to help traders better analyze commodity charts — Unit Conversion.
In combination with currency conversion, this function will help you evaluate the exchange rate difference of the commodity assets you are interested in. Or you can convert the chart to see the price of the item in a more familiar unit of measurement.
 To change the unit of measure on a chart where conversion is available, you need to click on the button on the scale that displays the current unit and select the unit of measure you’re interested in from the drop-down list.
After recalculation, the chart and indicators will display the price of the selected asset unit.
Please note that, at the moment, there are some special behaviors to converted charts, which differ from TradingView’s usual charts. These include:
- If you change the symbol, the chart will be displayed in the original unit of measure.
- You cannot create an alert or place an order on the converted chart. Alerts and orders created in the original unit will continue to work exactly the same as before.
- Drawing objects created on the converted chart are available only on this converted chart – they are stored and displayed with reference to the symbol, currency and unit of measure.
- In the converted currency or unit of measure mode, the Bar Replay feature isn’t available.
TradingView has been regularly enhancing its functionalities and adding new features. In January 2022, for instance, TradingView enabled instant synchronization of drawing objects.
This new functionality will be useful for those working in multiple browser tabs at once, on multiple devices, or in a browser and desktop app at the same time. With the new ability to instantly sync drawing objects, your charts will always be up-to-date, no matter where they are open, whether it is a browser, a mobile app on iOS or Android, or the TradingView desktop app — simply enable the autosave feature in your chart settings.