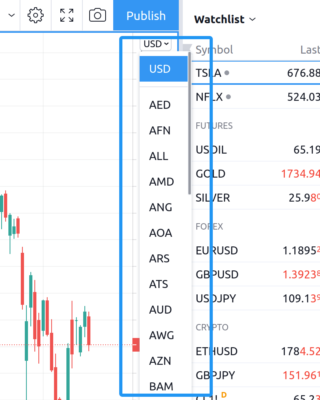
TradingView added a currency conversion feature: a new setting that enhances the analysis of the price chart for various assets. Now, traders can quickly assess the exchange rate difference of the currencies of interest or see the share price in a more familiar currency.
 To change the currency on the chart, you just need to click on the button displaying the scale currency and then select the currency you are interested in from the drop-down list.
The chart will be recalculated, taking into account the selected currency. OHLC values will be displayed, and the last price value will be indicated in the header of the browser tab. The indicators will also take into account that the currency has been converted.
It should be noted that at the moment there are some peculiarities on the chart with the converted currency:
- When the symbol is changed, the chart will be displayed in the original symbol currency.
- You cannot create an alert or place an order on the converted chart. Alerts and orders created in the original currency will continue to work exactly as before.
- Drawing objects created on a converted chart are available only on this converted chart because they are stored and displayed with reference to the symbol and currency.
- The Bar Replay feature is not available in converted currency mode.
TradingView is constantly improving its tools. For instance, in May, TradingView introduced Pine Tables – a new functionality that enables traders to present data in a way that has never been possible before.
Tables are objects that can be used to position information in specific and fixed locations in a script’s visual space. Contrary to all other plots or objects drawn in Pine, tables are not anchored to specific bars: they float in a script’s space, whether in overlay or pane mode, in studies or strategies, independently of the chart bars being viewed or the zoom factor used.