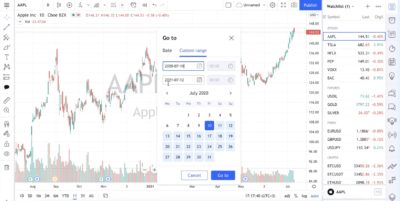
TradingView has announced a new option of managing time scales on charts.
Traders can select a specified range (day, month, year, etc.), they can choose a specific date on the chart, and now, finally, they can also go to a custom date range.
Just click on the Go to button, then select the Custom range tab and set two dates: “From” and “To” for the range you want to go to.

The TradingView platform is regularly updated. In July, for instance, TradingView announced the addition of a customizable indicator visibility feature. Traders can select a specific interval on which the indicator added to the chart will be displayed, or indicate a range (for example, show the instrument only on hourly timeframes).
The visibility of indicators is configured in line with drawing tools — open the settings menu, go to the “Visibility” tab and select the timeframe or interval at which you want to display the indicator. At other intervals, the tool will be hidden.
The list of recent additions also includes a currency conversion feature: a new setting that enhances the analysis of the price chart for various assets. Now, traders can quickly assess the exchange rate difference of the currencies of interest or see the share price in a more familiar currency.
To change the currency on the chart, you just need to click on the button displaying the scale currency and then select the currency you are interested in from the drop-down list.
The chart will be recalculated, taking into account the selected currency. OHLC values will be displayed, and the last price value will be indicated in the header of the browser tab. The indicators will also take into account that the currency has been converted.